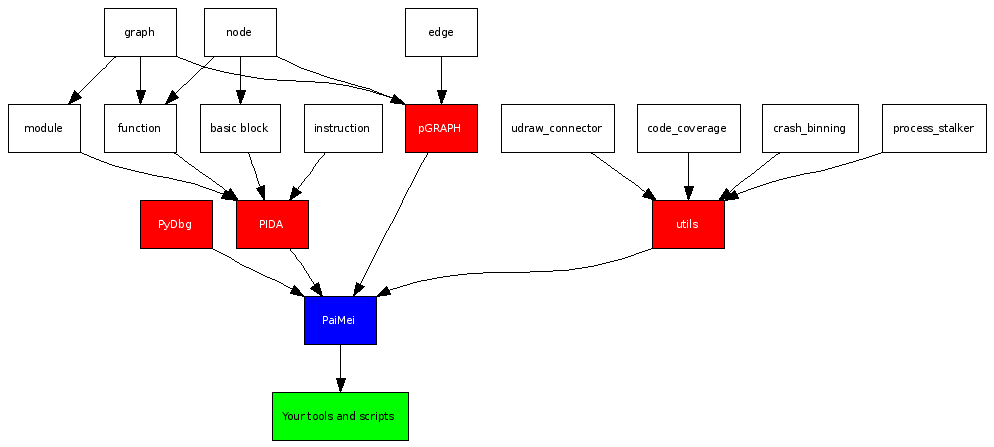
The crux of the PIDA component is based on IDA / IDA Python, which is used to propogate all of the initial structural data. Once the initial analysis is complete the data can be serialized to and loaded from a zlib compressed file. This allows you to extract all the relevant attributes you are interested in from the IDA database and access it "on the fly" in whatever standalone application you are creating. The usage of a generic Python binary representation allows us to consider dropping the reliance on IDA in the future. To generate a PIDA module currently, run the pida_dump.py IDA Python script after IDA has completed auto-analysis on your target binary.
The object structure is built on pGRAPH and can be thought of as a graph of graphs. Each component has it's own relevant attributes that we won't enumerate here. A module is a graph containing functions as nodes with the edges between the nodes representing the intramodular calls. Each function is a graph as well as a node. The nodes of a function are the basic blocks that it consists of (including chunked blocks). Each basic block is a node that contains a list of instructions. Finally, individual instructions are not graph objects but rather a simple struct with various attributes.
At any point you can take advantage of the graph abstraction to create arbitrary down / up graphs, graph intersections, graph concatenations, etc... The generated graphs can be rendered in either GML, GraphViz or uDraw formats. Consider the following simple example that will step through every function, basic block and instruction within a module and produce various outputs along the way:
    import pida

    module = pida.load("some_file.pida")

    # render a function graph in GML format for the entire module.
    fh = open("graphs/functions.gml", "w+")
    fh.write(module.render_graph_gml())
    fh.close()

    # render a function graph in uDraw format for the entire module.
    fh = open("graphs/functions.udg", "w+")
    fh.write(module.render_graph_udraw())
    fh.close()

    # step through each function in the module:
    for function in module.nodes.values():
        # if we found the first function we are interested in
        if function.ea_start == 0x00407950:
            # step through each basic block in the function.
            for bb in function.nodes.values():
                print "\t%08x - %08x" % (bb.ea_start, bb.ea_end)
                # print each instruction in each basic block.
                for ins in bb.instructions.values():
                    print "\t\t%s" % ins.disasm

            # render a GML graph of this function.
            fh = open("graphs/function.gml", "w+")
            fh.write(function.render_graph_gml())
            fh.close()

            # render a GraphViz PNG of this function too.
            graph = function.render_graph_graphviz()
            graph.write_png("graphs/function.png", prog="dot")

        # if we found the second function we are interested in.
        if function.name == "some_routine":
            # render a GML format proximity graph.
            fh = open("graphs/proximity.udg", "w+")
            # look 3 levels up and 2 levels down
            prox_graph = module.graph_proximity(function.id, 3, 2)
            fh.write(prox_graph.render_graph_udraw())
            fh.close()
Consider another, more real-world example. You need to locate all functions within a binary that at some point open a file. You want to display all possible execution paths from the entry point of each of these functions to the API call responsible for opening the file. Finally, you want to display this data as a graph, per function. The task is easily accomplished:
    # for each function in the module
    for function in module.functions.values():
        # create a downgraph from the current routine and locate the calls to [Open|Create]File[A|W]
        downgraph = module.graph down(function.ea start, -1)
        matches = [node for node in downgraph.nodes.values() if re.match(".*(create|open)file.*", node.name, re.I)]
        upgraph = pgraph.graph()

        # for each matching node create a temporary upgraph and add it to the parent upgraph.
        for node in matches:
            tmp_graph = module.graph up(node.ea start, -1)
            upgraph.graph cat(tmp_graph)

        # write the intersection of the down graph from the current function and the upgraph from
        # the discovered interested nodes to disk in gml format.
        downgraph.graph intersect(upgraph)

        if len(downgraph.nodes):
            fh = open("%s.gml" % function.name, "w+")
            fh.write(downgraph.render graph gml())
            fh.close()
Together, PIDA and PyDbg offer a powerful combination for building a variety of tools. Consider for example the ease of re-creating Process Stalker on top of this platform. Simply generate a PIDA module, load it in a PyDbg script, step through the functions / basic blocks within the module setting breakpoints along the way and finally register a breakpoint handler that logs the breakpoint hits to disk.
|  |


