# Reverse Engineering Automation
PaiMei is a reverse engineering framework written to cut the development time of random RE ideas from weeks to hours: PyDbg, pGRAPH, PIDA, a pluggable console and a pile of scripts. It debuted at RECON 2006. The project is long retired and I recommend looking elsewhere for modern RE automation, but the code lives on at github.com/OpenRCE/paimei and the original documentation follows, as written in 2006.
Overview
Introduction
PaiMei, is a reverse engineering framework consisting of multiple extensible components. The framework can essentially be thought of as a reverse engineer's swiss army knife and has already been proven effective for a wide range of both static and dynamic tasks such as fuzzer assistance, code coverage tracking, data flow tracking and more. The framework breaks down into the following core components:- PyDbg: A pure Python win32 debugging abstraction class.
- pGRAPH: A graph abstraction layer with seperate classes for nodes, edges and clusters.
- PIDA: Built on top of pGRAPH, PIDA aims to provide an abstract and persistent interface over binaries (DLLs and EXEs) with separate classes for representing functions, basic blocks and instructions. The end result is the creation of a portable file that when loaded allows you to arbitrarily navigate throughout the entire original binary.
- Utilities: A set of utilities for accomplishing various repetitive tasks.
- Console: A pluggable WxPython GUI for quickly and efficiently rolling out your own sexy RE utilities.
- Scripts: Individual scripts for accomplishing various tasks. One very important example of which is the pida_dump.py IDA Python script which is run from IDA to generate .PIDA modules.
PyDbg
PyDbg exposes most of the expected debugger functionality and then some. Hardware / software / memory breakpoints, process / module / thread enumeration and instrumentation, system DLL tracking, memory reading/writing and intelligent dereferencing, stack and SEH unwinding, exception and event handling, endian manipulation routines, memory snapshot and restore functionality, disassembly (libdasm) engine, and more ... The abstracted interface allows for painless development of custom debugger scripts. Diving right into the thick of things, consider the following example snippet:
    from pydbg import *
    from pydbg.defines import *

    def handler_breakpoint (pydbg):
       # ignore the first windows driven breakpoint.
       if pydbg.first_breakpoint:
           return DBG_CONTINUE

       log("ws2_32.recv() called from thread %d @%08x" % pydbg.dbg.dwThreadId, pydbg.exception_address)

       return DBG_CONTINUE

    dbg = pydbg()

    # register a breakpoint handler function.
    dbg.set_callback(EXCEPTION_BREAKPOINT, handler_breakpoint)
    dbg.attach(XXXXX)

    recv = dbg.func_resolve("ws2_32", "recv")
    dbg.bp_set(recv)

    pydbg.debug_event_loop()
We attach to a target process, set a breakpoint on ws2_32.recv() and print a message every time the API is called. All in less than 15 lines of code. Not too shabby.
PIDA
The crux of the PIDA component is based on IDA / IDA Python, which is used to propogate all of the initial structural data. Once the initial analysis is complete the data can be serialized to and loaded from a zlib compressed file. This allows you to extract all the relevant attributes you are interested in from the IDA database and access it "on the fly" in whatever standalone application you are creating. The usage of a generic Python binary representation allows us to consider dropping the reliance on IDA in the future. To generate a PIDA module currently, run the pida_dump.py IDA Python script after IDA has completed auto-analysis on your target binary.The object structure is built on pGRAPH and can be thought of as a graph of graphs. Each component has it's own relevant attributes that we won't enumerate here. A module is a graph containing functions as nodes with the edges between the nodes representing the intramodular calls. Each function is a graph as well as a node. The nodes of a function are the basic blocks that it consists of (including chunked blocks). Each basic block is a node that contains a list of instructions. Finally, individual instructions are not graph objects but rather a simple struct with various attributes.
At any point you can take advantage of the graph abstraction to create arbitrary down / up graphs, graph intersections, graph concatenations, etc... The generated graphs can be rendered in either GML, GraphViz or uDraw formats. Consider the following simple example that will step through every function, basic block and instruction within a module and produce various outputs along the way:
    import pida

    module = pida.load("some_file.pida")

    # render a function graph in GML format for the entire module.
    fh = open("graphs/functions.gml", "w+")
    fh.write(module.render_graph_gml())
    fh.close()

    # render a function graph in uDraw format for the entire module.
    fh = open("graphs/functions.udg", "w+")
    fh.write(module.render_graph_udraw())
    fh.close()

    # step through each function in the module:
    for function in module.nodes.values():
        # if we found the first function we are interested in
        if function.ea_start == 0x00407950:
            # step through each basic block in the function.
            for bb in function.nodes.values():
                print "\t%08x - %08x" % (bb.ea_start, bb.ea_end)
                # print each instruction in each basic block.
                for ins in bb.instructions.values():
                    print "\t\t%s" % ins.disasm

            # render a GML graph of this function.
            fh = open("graphs/function.gml", "w+")
            fh.write(function.render_graph_gml())
            fh.close()

            # render a GraphViz PNG of this function too.
            graph = function.render_graph_graphviz()
            graph.write_png("graphs/function.png", prog="dot")

        # if we found the second function we are interested in.
        if function.name == "some_routine":
            # render a GML format proximity graph.
            fh = open("graphs/proximity.udg", "w+")
            # look 3 levels up and 2 levels down
            prox_graph = module.graph_proximity(function.id, 3, 2)
            fh.write(prox_graph.render_graph_udraw())
            fh.close()
Consider another, more real-world example. You need to locate all functions within a binary that at some point open a file. You want to display all possible execution paths from the entry point of each of these functions to the API call responsible for opening the file. Finally, you want to display this data as a graph, per function. The task is easily accomplished:
    # for each function in the module
    for function in module.functions.values():
        # create a downgraph from the current routine and locate the calls to [Open|Create]File[A|W]
        downgraph = module.graph down(function.ea start, -1)
        matches = [node for node in downgraph.nodes.values() if re.match(".*(create|open)file.*", node.name, re.I)]
        upgraph = pgraph.graph()

        # for each matching node create a temporary upgraph and add it to the parent upgraph.
        for node in matches:
            tmp_graph = module.graph up(node.ea start, -1)
            upgraph.graph cat(tmp_graph)

        # write the intersection of the down graph from the current function and the upgraph from
        # the discovered interested nodes to disk in gml format.
        downgraph.graph intersect(upgraph)

        if len(downgraph.nodes):
            fh = open("%s.gml" % function.name, "w+")
            fh.write(downgraph.render graph gml())
            fh.close()
Together, PIDA and PyDbg offer a powerful combination for building a variety of tools. Consider for example the ease of re-creating Process Stalker on top of this platform. Simply generate a PIDA module, load it in a PyDbg script, step through the functions / basic blocks within the module setting breakpoints along the way and finally register a breakpoint handler that logs the breakpoint hits to disk.
Entity Relationship Diagram
The following entity relationship diagram should give you a good overall feel for how the framework is organized: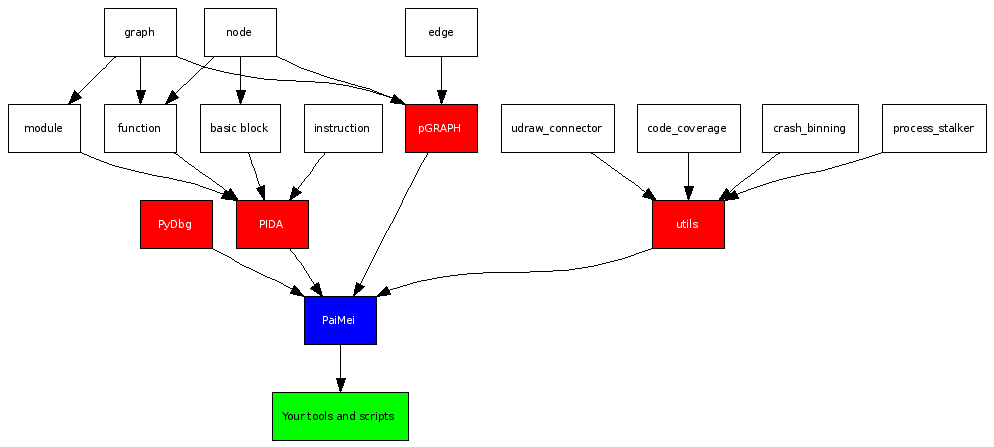
Future Development
There are a bunch of tools and utilities I want to and have already built on this framework. One major need for improvement is in the memory consumption of loaded PIDA modules. Full analysis (vs. function or basic block only) PIDA modules consume a drastic amount of memory. The likely solution to this problem will be to create some form of "on demand" access to the underlying data as opposed to loading the entire data structure into memory from the get go. If anyone has a creative solution to this problem, please let me know.Installation
Quick Start
The quickest way to get up and running with an almost full installation of the framework is as follows:- Install Python 2.4, Windows Python-2.4.3.msi
- Launch __install_requirements.py and follow the interactive prompts to download / install requirements.
- Launch __setup_mysql.py (requires command line arguments) to setup the MySQL database for pstalker.
- Launch console\PAIMEIconsole.py to pull up the GUI.
- Install IDA Python.
- Launch IDA, load a target executable and run the pida_dump.py IDA Python script to generate a PIDA file.
- Load the PIDA file in the GUI and you're up and running.
Detailed Installation Guide
I won't lie to you, there are a number of pre-requisites for a complete install of the PaiMei framework. Luckily, none of them are difficult to install and many of them you probably already have. Not every portion of the framework relies on all of the pre-reqs. The following table should help you get started on deciding what you will need:| Requirement | Available From | PyDbg | PIDA | GUI | Needed For |
| Python 2.4 | http://www.python.org | Y | Y | Y | Everything ;-) You definetely need to have this. |
| IDA Pro | http://www.datarescue.com/idabase/ | Y | Static analysis such as for PIDA generation. You probably already have this. | ||
| IDA Python | http://www.d-dome.net/idapython | Y | PIDA generation, process stalking. You should install this if you haven't already. | ||
| WxPython | http://www.wxpython.org | Y | Wx is required for PAIMEIconsole, the GUI component. If you don't plan on using the GUI, don't worry about this. | ||
| MySQL / MySQLdb | http://www.mysql.org http://sourceforge.net/projects/mysql-python |
Y | The PAIMEIpstalker code coverage tool requires a MySQL database and the Python bindings. The code coverage utility can also store/load from disk, so you only need this module if you plan on using the GUI. | ||
| Python ctypes | http://starship.python.net/crew/theller/ctypes/ | Y | Y | Required for PyDbg and portions of the console, such as the code coverage tool. | |
| uDraw(Graph) | http://www.informatik.uni-bremen.de/uDrawGraph/en/home.html | Required only if you wish to generate static / interactive graphs with uDraw. I recommend you install this. | |||
| GraphViz / PyDot | http://www.graphviz.org http://dkbza.org/pydot.html |
Required only if you wish to generate static graphs in Dot. You probably don't need this module. | |||
| Oreas GDE | http://www.oreas.com/gde_en.php | Required for GML rendering. Of the 3 currently supported graph rendering routines, this is the prettiest. |
You can run the __install_requirements.py Python script to help determine which of the above components you already have installed and to automatically download and install missing components. Once you have all the pre-requisites up and running, to install the PyDbg, pGRAPH, PIDA and utility libraries to your system wide Python directory, simply run the included Microsoft Windows installer. You can then individually launch the console or various scripts from any path on the system. Alternatively, you can keep the entire package: console, scripts, libraries and all together. For a full installation, the final step is to setup the paimei MySQL database. The database name is not optional. You can either manually setup the database yourself using the schema described in "docs\SQL Structure.txt". Alternatively, you can use the __setup_mysql.py helper script to do the work for you.
With everything installed and operational you can launch the GUI console through console\PAIMEIconsole.pyw or start tinkering with the various included scripts such as debuggee_procedure_call.py.
Scripts and Tools
Debuggee Procedure Call (DPC)
Interface: Command LineRequires: PyDbg
This allows you to attach to a process and call arbitrary functions for exploratory purposes. Once attached you are presented with a prompt that can accept any valid Python statements. Use the dbg variable to access the current PyDbg instance pointer. For example if you want to resolve the address of an API, you can call dbg.func_resolve_debuggee(). A few convenience wrappers exist for allocating (alloc()), free-ing (free(), free_all()) and displaying allocated chunks (show_all()) of memory. To call a function within the debuggee, use the dpc() routine. This routine is the real core of the script. Given an address and arguments it will allocate and initialize space in the debuggee for storing the necessary instructions and arguments and then redirect EIP from the current thread to the newly created instructions. A breakpoint is written after the assembled instruction set that is caught by our breakpoint handler which re-prompts the user for further commands. Note: You *can not* directly assign the return value from dpc(). You must explicitly assign Eax, example:
    var = dpc(0xdeadbeef, "pedram")     # INCORRECT

    dpc(0xdeadbeef, "pedram")           # CORRECT
    var = dbg.context.Eax
DPC also supports fast-call, to use simple specify a register value as a keyword argument. For example:
dpc(function, 10, "string", eax=0xdeadbeef, ecx="string")
Other valid commands from the prompt include DONE, GO and G for leaving the command prompt loop and continuing the process (available for more advanced usage of the script). On a final note, while assigning variables from the command prompt is perfectly ok, assigned variables are not persistant across calls to dpc() or the various continue commands. A special global class pointer is available for storing persistant variables called glob, usage is simple:
    glob.string = "A" * 500
    glob.list   = []
    glob.mbox   = dbg.func_resolve("user32", "MessageBoxA")
To view assigned variables within the glob structure, simply print glob.
The general logic of the script is as follows:
- Allocate memory in the process.
- Reverse the argument list.
- For each numeric argument generate and write a PUSH instruction to the allocated block.
- For each string argument, allocate memory for the string then generate and write a PUSH instruction to the allocated block.
- For each specified register value, set it appropriately. If it is a string, allocate memory for the string and place the string address in the register.
- Generate and write a CALL instruction to the allocated block.
- Write an INT 3 (breakpoint) to the allocated block to resume debugger control and re-prompt the user for further inputs.
OllyDbg Connector / Receiver
Interface: Command line, OllyDbgRequires: uDraw, PIDA, OllyDbg
To use this utility you must install the OllyDbg connector plug-in from ollydbg_connector\Release, source code for the plug-in is available. Once installed, three new hotkeys are registered:
- , < Step into (F7) and transmit current location to OllyDbg receiver.
- . > Step over (F8) and transmit current location to OllyDbg receiver.
- / ? Transmit current location to OllyDbg receiver.
"C:\Program Files\uDraw(Graph)\bin\uDrawGraph.exe" -server
When you transmit your location at the top of a function, a call graph is displayed. When you transmit your location from within a function, a control-flow graph is displayed. The current node you are in is highlighted orange, previously visited (and transmitted) nodes are highlighted in blue.
PIDA Dump / Load
Interface: IDARequires: PIDA, IDA
The PIDA dump script, pida_dump.py, is an IDA Python script that must be run after IDA has completed its auto-analysis on your target binary. The script presents a few dialogs prior to asking for the output PIDA module name. The first is what level of analysis you want "functions", "basic blocks" or "full". The memory consumption and file size difference between each of the three levels of analysis are drastically different, most notably so between "basic blocks" and "full". The next option controls whether or not to create nodes and edges within the PIDA module for API calls, if you're interested in seeing the relationship between the routines within your module and API calls then you should enable this option. Finally, you are asked if you would like the dump script to enumerate any available RPC interfaces and dispatch routines in the current module.
Note: If you are generating a PIDA module for whatever.dll, you *must* name the PIDA module whatever.dll.pida as a number of tools / utilities (such as pstalker and the OllyDbg receiver) expect this convention.
The PIDA load script, pida_load.py, is more of an example than anything else. Demonstrating how to load the contents of a PIDA module into memory. Occasionally, I find use in actually loading a PIDA module into my IDA session, this script can be used to accomplish that task.
Proc Peek / Proc Peek Recon
Interface: IDA, command lineRequires: PyDbg, IDA Python
This is a two part utility designed for locating "low hanging fruit" vulnerabilities in Windows software. To use this utility, you must first run the proc_peek_recon.py IDA Python script, again after IDA has finished its auto-analysis. A .recon file will be generated that contains the locations (I call these "peek points") of various potentially interesting locations within the binary. Example locations include discovered inline memcpy()'s, calls to various routines that take format strings and are passed a %s format string token as well as calls to potentially dangerous API such as strcat, strcpy and the like. For the full list, see the source code. It's by no means an exhaustive list in the current release.
Once the .recon file is generated, use the proc_peek.py script to attach to your target process and examine the data that comes across those various interesting locations. There are various command line options:
- <-r | --recon RECON FILE>: name of proc_peek_recon output file, this is the only required argument
- [-p | --pid PID]: pid to attach to (must specify this or watch)
- [-w | --watch PROC]: target name to watch for and attach to
- [-i | --ignore PID]: ignore a specific PID when watching for a target
- [-n | --noint]: disable interactive prompts
- [-q | --quiet]: disable run-time context dumps
- [-l | --log LOG FILE]: report to file instead of screen
- [-h | --host REMOTE HOST]: connect to a pydbg server
- [-b | --boron KEYWORD]: alert us when a keyword is found within the context
- [-t | --track_recv]: enable recv() and recvfrom() hit logging
Console (GUI) and Modules
Console Menus
Connectons\MySQL Connect
Establish a console wide connection to your database server. A MySQL connection is required for example in the pstalker module.Connectons\PyDbg Locale
This option controls the console wide PyDbg setting of whether to debug remotely or locally. In the public release of PaiMei, only local debugging is supported and therefore you should never need to change this option.Connectons\uDraw(Graph) Connect
Establish a console wide socket connection to udraw(Graph). A connection to uDraw is required only if you plan on doing dynamic graphing. The pstalker "uDraw Sync" command for example requires uDraw connectivity. Note: uDraw must be started with the -server option in order to be in listening mode. Example:
"C:\Program Files\uDraw(Graph)\bin\uDrawGraph.exe" -server
Advanced\Clear Log
Clear the log window of the currently selected module.Advanced\Toggle Python Shell
Show or hide the PaiMei command line interface.Help\About
Display the about dialog box.Console Command Line Interface
The CLI is toggled with the Advanced\Toggle Python Shell menu option. Using the CLI, you can accomplish various advanced tasks that are otherwise not accessible through the GUI. The top level variable for accessing the namespace within the console is paimei, a shortcut alias of simply p is also available. While every attribute of each module will be accessible to your through the CLI, the author of any given module has the ability to document specific variables that you will likely be interested in. The documentation for the global and per module namespace is available on the right hand side of the CLI interface. Select the module (or 'PaiMei' for global) from the drop down to display a list of exposed variables. Select a variable to reveal the description. The CLI is a fully functional Python interpreter, so feel free to execute any Python statement or import any module you desire.PAIMEdiff
This module has not yet been publicly released.PAIMEIdocs
This module defaults to loading the documentation you are currently reading. Use the drop down menu at the top to select another category of documentation.PAIMEIexplore
The public release of this module is sort of the "hello world" of the PaiMei console. Load a PIDA module into the top list control, then double click on it to load it into the tree control. Explore the various functions and basic blocks within the PIDA module. A full disassembly is displayed in the center panel. Connect to uDraw and view the control-flow graph of individual functions through the right-click context menu.PAIMEIfilefuzz
TODO: add docsPAIMEIpstalker
The pstalker module is intended to replace the earlier developed Process Stalker code coverage tool. While the currently exposed feature set is not as robust at what was previously possible using the various command line utilities, one of the biggest improvements to Process Stalker is the storage of metadata to MySQL as opposed to multiple files that can quickly get disorganized and confusing.Overview
The pstalker module is broken into three distinct columns. Data Sources, which is where you manage and create the targets you are stalking as well as load the appropriate PIDA modules. Data Exploration, where you can view the results of any individual code coverage run or "stalk". Data Capture, which is where you select the process and options to stalk. The general workflow associated with this tool is as follows, read on for specifics:- Create a new target and/or tag. Targets can contain multiple tags and each individual tag contains it's own saved code coverage data.
- Select a tag for staking.
- Load PIDA modules for every .DLL and the .EXE you wish to stalk.
- Launch your target.
- Refresh the process list under the data capture panel and select your target process for attaching or browse to the target process for loading.
- Configure the code coverage options and attach to the selected target.
- Interact with your target while code coverage is being recorded.
- When you are ready, detach from the target and wait for pstalker to export captured items to the database.
- Load the recorded hits to begin exploring your recorded data.
Data Sources
After you first establish console-wide MySQL connectivity, hit the "Retrieve Target List" button to propogate the data source explorer tree. Obviously if this is your first run it will be empty. You can add a new target from the right-click context menu of the root node labeled "Available Targets". The right-click context menu for individual targets allow you to delete the target, add a tag under the target as well as load the hits from all tags under the target into the data exploration pane. The right-click context menu for individual tags exposes a number of features:- Load Hits, clear the data exploration pane and load the hits associated with the selected tag.
- Append Hits, append the hits associated with the selected tag after any existing data currently in the exploration pane.
- Export to IDA, export the hits under the selected tag as an IDC script suitable for import in IDA to highlight the hit functions / blocks.
- Sync with uDraw, synchronize the data exploration pane on the console-wide uDraw connection. Dual monitors are very helpful for this feature.
- Use for Stalking, store all recorded hits during data capture phase to the selected tag. You must select a tag for stalking prior to attaching to a process.
- Filter Tag, do not record hits for any of the nodes / basic blocks under the selected tag in future stalks. You can mark more then one tag for filtering.
- Clear Tag, keep the tag but remove all the hits stored under the tag. You can not stalk into a tag with any pre-existing data, so if you want to overwrite the contents of a tag be sure to clear it first.
- Expand Tag, for each hit function in the tag, generate and add an entry for every contained basic block, even if that basic block was not explicitly hit.
- Target/Tag Properties, modify the tag name, view/edit tag notes or modify the target name.
- Delete Tag, remove the tag and all the hits stored under the tag.
Data Exploration
The data exploraton pane is broken into three sections. The first section is propogated when you load or append hits from the Data Sources column. Each hit is displayed in a scrollable list box. Selecting one of the line items displays, if available, the context data associated with that hit in the Dereferenced Data text control. In between the list and text controls there are two progress bars that represent the total code coverage based on the number of individually hit basic blocks and functions listed in the exploration pane against the number of total basic blocks and functions across all loaded PIDA modules.Data Capture
Once you have a tag selected for stalking, any appropriate filters applied and your target PIDA modules loaded, the next step is to actually attach to and stalk your target. Hit the Retrieve List button to display an up to date process list, newer processes are listed at the bottom. Select your target process for attaching or browse to your target process for loading, next select your coverage depth. Select Functions to monitor and track which functions are executed within your target or select Basic Blocks to further scrutinize the individual basic blocks executed. The Restore BPs checkbox controls whether or not to restore breakpoints after they have been hit. If you are only interested in what code was executed in your target, then leave the option disabled. Alternatively, if you are interested in both what was executed and the order in which it was executed, then you should enable the option. The Heavy checkbox controls whether or not pstalker will save context data at each recorded hit. Disable this option for increased speed. Uncheck the Unhandled Only check box to receive notification of debug exception events even if the debuggee is capable of correctly handling them. Finally, with all your options set and your target process selected hit the Attach and Start Tracking button to begin code coverage. Watch the log window for run-time information.Limitations
There is one main limitation to this tool that you should be aware of. Specifically, the tool is reliant on the static analysis of the binary provided by IDA then it will fail when IDA makes mistakes. For example, if data is misrepresented as code then bad things can happen when pstalker sets breakpoints on that data. This is the most common reason for failure. Disabling the "Make final pass" analysis kernel option in IDA prior to the auto-analysis will disable the aggressive logic that makes these types of errors. However, your overall analysis will also suffer. Furthermore, packed or self-modifying code can not be traced currently.Developer Docs
Working with the Libraries
Overview
As a developer you have two options for building tools on top of the framework, you can either create a command line tool or you can go one step further and create a module for the console (GUI). Aside from existing scripts and examples, the best reference for developers building utilities on top of PaiMei is the generated Epydoc documentation:pGRAPH
TODO: add docs and examplesPIDA
TODO: add docs and examplesPyDbg
TODO: add docs and examplesUtilities
TODO: add docs and examplesCreating GUI Modules
Overview
If you plan on creating a module for PaiMei, read through this document and refer to existing modules for examples. There are a few standards that should be met in order to maintain consistency across the framework. If you want your tool included in the default public release bundle, please contact me directly: pedram [dot] amini [at] gmail [dot] com. You should know in advance however that I am completely obsessive compulsive with my code ... so make it clean and please document ;-)Structure
PaiMei will scan the images/icons directory on startup, looking for modules to load. If you create a new module and do not create an icon for it, your module will be ignored. The Photoshop template for icons is available in the docs directory, it is named Listbook Graphic Templates.psd. The core of the module itself must be implemented as a WxPanel and placed in the modules directory with the same name of the icon. All modules should be prefixed with "PAIMEI" and contain only lower-case letters in the name. For example, to add a module named 'explorer', create the following files:
    images\icons\PAIMEIexplorer.png
    modules\PAIMEIexplorer.py
Support files for your module should be placed under a subdirectory within modules with the name '_PAIMEI[module name]'. Following our example:
modules\_PAIMEIexplorer\*
WxGlade
I recommend using WxGlade to build the basic structure / layout of your GUI module. Recall that the module you are creating must be implemented as a WxPanel. Launch WxGlade and create a new panel, naming both the panel and class 'PAIMEI[module_name]'. Select the option "Separate file for each class" and generate the Python code for your module. The panel you created will be implemented in 'PAIMEI[module name].py'. This is the file you will be editing / adding to. I've included the WxGlade project used to create some of the GUI panels and controls distributed with the first release of PaiMei in the top level docs directory, named PAIMEIwxglade.wxg.Functions and Variables
All module variables that you wish to expose to the user should be declared as class level variables. Class variables must be documented such as to guide users who may be interacting with your module through the command line interface. To document the variable, add an entry to the 'documented_properties' dictionary. Example:
    documented_properties = {
        "pida_modules" : "Dictionary of loaded PIDA modules.",
    }
There are two class variables that you should declare in your module to access the global PaiMei namespace, self.list_book and self.main_frame:
    self.list_book  = kwds["parent"]             # handle to list book.
    self.main_frame = self.list_book.top         # handle to top most frame.
These handles are necessary for accessing the namespace of other modules and, more importantly, accessing the top level MySQL, PyDbg and uDraw variables (through self.main_frame.xxxx). When creating new controls, you should pass self, which within the control should be assigned to self.top, so that individual controls can access these variables as well (through self.top.main_frame.xxxx
Interacting with the Status Bar
The PaiMei status bar is split into two halves. The left half is reserved for the framework, the right half is for you to use freely for your module. Utilization of the status bar is optional, the method for interacting with the status bar is not. To begin, you must define two routines in your module:
    ####################################################################################################################
    def _get_status (self):
        '''
        Return the text to display in the status bar on page change.
        '''

        return self.status_msg

    ####################################################################################################################
    def _set_status (self, status_msg):
        '''
        Set the text to display in the status bar.
        '''

        self.status_msg = status_msg
        self.main_frame.status_bar.SetStatusText(self.status_msg, 1)
The _get_status() routine is called from the console as the user selects between various modules. This allows your module to maintain a status message persistently as the user transitions back and forth between modules.
Creating a Log Window
Utilizing a log window is optional. However, if you plan on using one it should be placed within a splitter and must be named 'log'. You must then create and bind a routine for handing situations where generated log data exceeds the maximum size of the log control:
    self.Bind(wx.EVT_TEXT_MAXLEN, self.OnMaxLogLengthReached, self.log)

    ####################################################################################################################
    def OnMaxLogLengthReached (self, event):
        '''
        Clear the log window when the max length is reach.

        @todo: Make this smarter by maybe only clearing half the lines.
        '''

        self.log.SetValue("")
If you are placing your log control in a splitter window (which is wise) and you want to prevent the user from accidentally closing the log window. Then set a minimum pane size on the containing sizer:
self.log_splitter.SetMinimumPaneSize(25)
Finally, create and utilize the following shortcut routines to the log control:
    ####################################################################################################################
    def err (self, message):
        '''
        Write an error message to log window.
        '''

        self.log.AppendText("[!] %s\n" % message)


    ####################################################################################################################
    def msg (self, message):
        '''
        Write a log message to log window.
        '''

        self.log.AppendText("[*] %s\n" % message)
Take Pride in your Work
At the bottom of the __init__() routine for your main wxPanel, write your name and module name to the log window:
    self.msg("PaiMei Explorer")
    self.msg("Module by Pedram Amini\n")
Some Final Notes
In case you haven't already noticed, there is no console-wide (global) PIDA modules container. Instead, each GUI module within PaiMei is responsible for loading and storing it's own PIDA modules. The reasoning behind this is that various console modules may have custom modifications they may need to make to the PIDA module on load, that can result in incompatibilities with other console modules. These leads to the natural question of, how does one add their own attributes to PIDA modules? Every class within the PIDA structure (module, function, basic block and instruction) contains a default-empty dictionary variable named ext (for extension or extending). To add your own attributes, simply create a new dictionary key with your module name and assign whatever type you want to it. For example, if I want to add a count of the number of times specific functions were accessed within a PIDA module, I might create the following addition:
    for key in module.functions.keys():
        module.functions[key].ext["PAIMEIexplore"] = {}
        module.functions[key].ext["PAIMEIexplore"]["hit_count"] = 0
If you want to save your attribute extensions, simply dump the PIDA module back to disk. The ext dictionary will be included in the file and restored the next time it is loaded.