# Branch Tracing with Intel MSR Registers · 2006-12-13
The ability to "trace" code is rather useful and can be leveraged to ease the burden of a number of tasks ranging from standard issue debugging to vulnerability hunting to malware analysis and more. Debuggers such as OllyDbg implement code tracing via conventional single stepping. This is easily accomplished in a debugger by setting the appropriate EFlag bit in the thread context you wish to single step (Python Win32 example):
    context = self.get_thread_context(thread_handle)
    context.EFlags = context.EFlags & (0xFFFFFFFFFF ^ EFLAGS_TRAP)
    self.set_thread_context(context, thread_handle=thread_handle)
One by one, as instructions are executed the debugger is trapped with an EXCEPTION_SINGLE_STEP event. In the case of OllyDbg, various register states are stored and execution is continued. For those of you who haven't used this feature before, believe me when I say that it's painfully slow on medium to large chunks of code. This was one of my main motivations behind creating the PaiMei Process Stalker module. Process Stalker improves code tracing speed by monitoring execution of basic blocks as opposed to individual instructions. What exactly does this mean? Sequences of assembly instructions can be broken down into "basic blocks". Basic blocks can be grouped together to form Control-Flow Graphs (CFGs). These are familiar terms but for those of you who don't know it, consider the following example deadlisting:
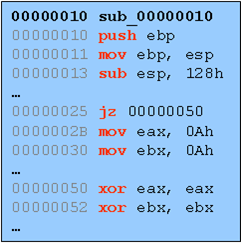
This straight sequence can be broken into basic blocks which are defined as sub-sequences of instructions where each instruction within the block is guaranteed to be run, in order, once the first instruction of the basic block is reached. The strict definition for basic blocks differs here and there, for example you may or may not want to consider a CALL instruction the end of a basic block (depending on whether you care to take the effort to determine if that CALL is guaranteed to return). You get the general idea though. Here is that same sequence broken down into a CFG:
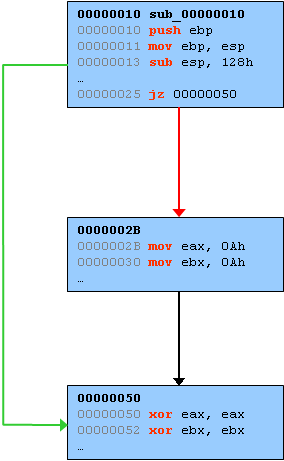
Instead of tracing code at the instruction level, Process Stalker traces code at a higher level by setting and monitoring breakpoints at the head of every basic block. Since every instruction within a block is guaranteed to be executed once the block is reached, there is no need to trace any further into the block. Improving code trace speed using the basic block method is not a novel idea, SABRE Securities commercial product Bin Navi utilizies the same technique. Even more creative mechanisms for improving trace speed have been developed as well: See Matt Conover's project list at http://www.cybertech.net/~sh0ksh0k/projects/ as well as the recent blog entry and tool announce from McAfee at UMSS: Efficient Single Stepping on Win32.
There are downfalls to all of these shortcuts howevever. The creative ones can get quite complicated and the basic block method requires that the target binary is pre-analyzed to determine the location of all the basic blocks. To successfully enumerate basic blocks you must first correctly differentiate between code and data within an individual binary. This is harder said then done which is why both Process Stalker and Bin Navi really on IDA Pro's analysis. This is a drag because not only does it introduce significant steps to setup the trace but IDA can make mistakes that can botch the entire trace. An improved version of basic block tracing is desired.
Some time ago I was flipping through the IA-32 Intel Architecture Softwre Developer's Manual Volume 3 when I came across the following information in section 15.5 (page 515, specific to the provided link):
    The MSR_DEBUGCTLA MSR enables and disables the various
    last branch recording mechanisms described in the previous
    section. This register can be written to using the WRMSR
    instruction, when operating at privilege level 0 or when
    in real-address mode. A protected-mode operating system
    procedure is required to provide user access to this register.
    Figure 15-4 shows the flags in the MSR_DEBUGCTLA MSR. The
    functions of these flags are as follows:
    ...
    BTF (single-step on branches) flag (bit 1)
    When set, the processor treats the TF flag in the EFLAGS
    register as a "singlestep on branches" flag rather than a
    "single-step on instructions" flag. This mechanism allows
    single-stepping the processor on taken branches, interrupts,
    and exceptions. See Section 15.5.4., "Single-Stepping on
    Branches, Exceptions, and Interrupts" for more information
    about the BTF flag.
According to the documentation, the behaviour of single step can be altered through a flag in one of the Model Specific Registers (MSRs). So I threw some PyDbg based Python code together to test this out. First, I implemented a conventional single step tracer: tracer_single_step.py. Next, I modified that tracer with the appropriate MSR setting code: tracer_msr_branch.py. Ran them both and to my pleasant surprise it worked like a charm. Try them for yourself. Attach to and interact with calculator with the single step tracer then try it again with the MSR tracer, the speed difference is quite notable. Implementing the MSR tracer required almost minimal changes. First, some definitions:
    SysDbgReadMsr  = 16
    SysDbgWriteMsr = 17

    ULONG     = c_ulong
    ULONGLONG = c_ulonglong

    class SYSDBG_MSR(Structure):
        _fields_ = [
            ("Address", ULONG),
            ("Data",    ULONGLONG),
    ]

    def write_msr():
        msr = SYSDBG_MSR()
        msr.Address = 0x1D9
        msr.Data = 2
        status = windll.ntdll.NtSystemDebugControl( \
            SysDbgWriteMsr,
            byref(msr),
            sizeof(SYSDBG_MSR),
            0,
            0,
            0);
The write_msr() routine defined above utilizes the NtSystemDebugControl() Windows native API (special thanks to Alex Ionescu for his help with this) to set the appropriate MSR values specific to my Pentium M processor. Your mileage may vary with those values, check the Intel manual for the appropriate numbers. Next, all you have to do is follow every call to single_step() with a call to write_msr():
    # re-raise the single step flag on every block.
    def handler_single_step (dbg):
        ...
        dbg.single_step(True)
        write_msr()
        return DBG_CONTINUE

    # ensure every new thread starts in single step mode.
    def handler_new_thread (dbg):
        dbg.single_step(True)
        write_msr()
        return DBG_CONTINUE
I'll be adding MSR routines to PyDbg in a future release and will also release a new version of Process Stalker that does not require any pre-analysis to accomplish its code tracing... When I find the time to do all that I may expand this blog entry with further details and examples into a full blown article.
Caveat Emptor: It appears that you can kill your CPU if you carelessly fool around with MSRs. So there, I said it, be warned.