| Process Stalking |
Overview
Process Stalking® is a term coined to describe the combined process of run-time profiling, state mapping and tracing. Consisting of a series of tools and scripts the goal of a successful stalk is to provide the reverse engineer with a intuitive interface to run-time block-level trace data.
The Process Stalking suite is broken into three main components; an IDA Pro plug-in, a stand alone tracing tool and a series of Python scripts for instrumenting intermediary and GML graph files. The generated GML graph definitions were designed for usage with a freely available interactive graph visualization tool.
Manual
A complete usage and script development manual for Process Stalker is available here.
OpenRCE.org Article
An article detailing a step-by-step application of Process Stalker vs. the MS05-030 Microsoft Security bulletin is available at OpenRCE.org
Example
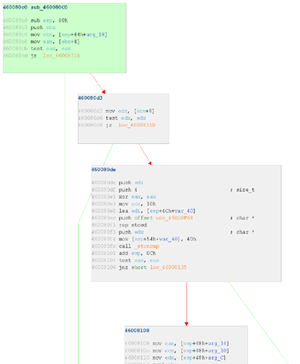
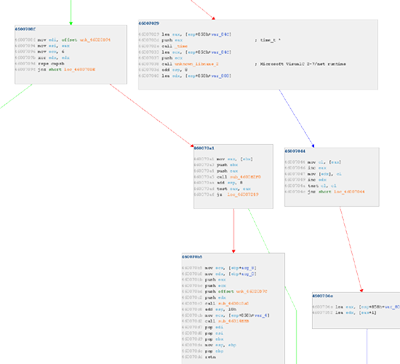
The following simple example will provide a quick and dirty understanding of one of the benefits of stalking. The following two graphs are from 2 of the ~500 functions defined in IRC.DLL distributed by Trillian 3. Click on any graph for the full sized version.

Hierarchical layout of function 1 from Trillian IRC.DLL
Generated graphs are interactive, editable, sport instruction level coloring for easy reading and can be displayed with a number of layout algorithms such as hierarchical, orthogonal, symmetric, circular, etc... Entry points are highlighted in green, true/false branches are colored green/red accordingly and implicit edges are colored blue.

Hierarchical layout of function 2 from Trillian IRC.DLL
The above input graphs are generated before any stalking takes place. We attach the Process Stalker to the target Trillian process, connect to an IRC server and enter a recorder mode. From another IRC client we generate a CTCP message to the target Trillian process. Once the command was received we stop the recorder mode and run our post-processing scripts to generate the following two example graphs.

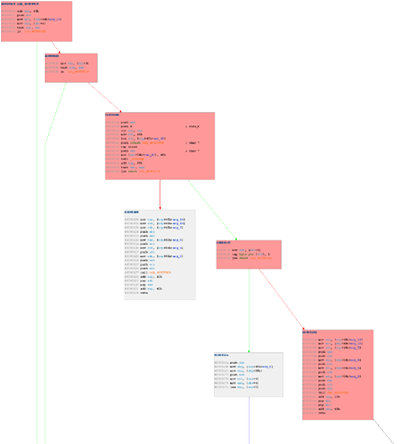
Hierarchical layout of Process Stalker output from /ctcp request
The above graph shows the combined hierarchical graph of the first two graphs with "hit" basic blocks highlighted in red. The researcher is easily able to locate the functions and specific control flow blocks that are involved in handling the specific CTCP message. At this stage branch conditions can be examined for increasing code coverage, a binary level audit can be conducted on only "reachable" code so as not to waste any efforts, etc...

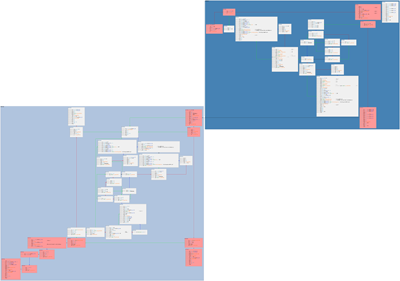
Cluster orthogonal layout of Process Stalker output from /ctcp request
The above graph is identical to the ctcp_hierarchical graph except displayed with the cluster orthogonal layout. Functions are clumped together in colored clusters, the same node/edge level coloring applies as before.