| Kraken Botnet Infiltration | 2008-04-28 |
Earlier this month a number of articles surfaced on the research and disagreements with regards to the size and classification of a large bot net named Kraken. At the front line of the debate was SecureWorks and Damballa. Secureworks claims Kraken is actually Bobax and estimates the bot net to include over 185,000 compromised systems. Damballa disagrees stating that Kraken is an entirely new bot net with a size over twice as large as Storm. Semantics aside no one disagrees that Kraken/Bobax is among the largest of the known bot nets if not the largest.
Cody and I thought it would be interesting to examine Kraken with the specific goal of infiltrating the bot network. We started with a sample from Offensive Computing and working from there eventually concluded that we would indeed be able to infiltrate and take over increasingly larger portions of the Kraken bot net. Cody did most of the manual labor of protocol dissection, reverse engineering the encryption routines and eventually creating a fake Kraken server capable of overtaking a redirected zombie. His detailed write up on the reverse engineering process is available under "Owning Kraken".
The key to overtaking the botnet is understanding how the overall client-server architecture works. Kraken infected systems attempt to "phone home" to a master command and control server by systematically generating sub-domains from various dynamic DNS resolver services such as dyndns.com. By reverse engineering the list of names and successfully registering some of the sub-domains Kraken is looking for, we can emulate a server and begin to infiltrate the network zombie by zombie. Stated simply, Kraken infected systems world wide start to connect to a server we control.
We monitored Kraken connections for a period of one week (seven days). In that time we have received over 1.8 million requests from infected systems worldwide. Of these requests over 65,000 came from unique IP addresses. Here is our list of all uniquely infected IP addresses. This number still does not accurately capture the true infection count monitored. Why? Think about the systems who are constantly rebooted, assigned a new IP address and then re-connect to the command and control server. We can do better thanks to the fact that the initial request from the Kraken zombies contains an encryption key generated in such a manner that makes it constant per system but unique across systems (see "Owning Kraken" for further details). Counting at this level of granularity leaves us with 25,000 truly unique infections monitored over seven days ... and growing, we are seeing a fairly uniform number of new infections a day.
Applying a reverse DNS lookup over this set of IP addresses reveals that the bulk of the monitored infected user base is home broadband users. The source country distributions break down as follows: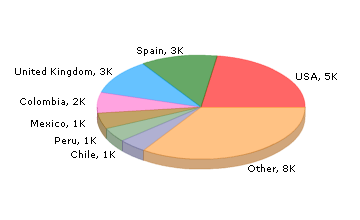
The initial Kraken zombie request also contains a version field which we parsed and found to contain the following distribution: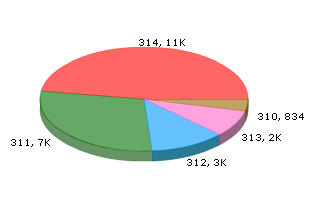
Various estimates place the overall size of the botnet to be somewhere
between 185,000 and 600,000 zombies. This means that within a single week we would have been able to take over anywhere from 4% to 14% of the infected population ... and this is where we entered into a moral dilemma and ethical discussion. We have the ability to successfully redirect infected systems. We have the ability to provide an 'update' through the existing Kraken protocol that can simply remove the Kraken zombie (again see "Owning Kraken" for a video demonstrating this capability). Is it wrong to do so? Although this discussion is similar to that of writing "good worms" that roam the internet patching vulnerable servers, there is a key difference in that a good worm can't be stopped. Once it has been released it is a self spreading uncontrollable entity. In our specific case however we have the ability to cease at any point. It is simply a one to one relationship. An infected system connects to us, we supply a simple binary to kill the target process, we never hear from the infected system again and neither can the actual botnet owners command and control servers.
Cody and I both are pro "cleansing". Dave Endler on the other hand is against. The arguments for pro-cleansing are obvious, the arguments against are a little more complicated. The most interesting of points that Dave brought up is the corner case of what happens if we accidentally crash the target system? What if that target system is responsible for someone's life support? Yes the system is already infected with a SPAM delivering zombie capable of receiving arbitrary updates from malicious actors, but at least for now it's running and carrying out the rest of it's functionality. As director of DVLabs, Dave's opinion overshadows that of our own so we simply sit and monitor. What are your personal thoughts on the matter?
Owning Kraken Zombies, a Detailed Dissection
This dissection was written by Cody Pierce and published alongside the post above.
This blog contains the deep technical dive of a two-part blog series exploring the Kraken botnet. See "Kraken Botnet Infiltration" for more information regarding general statistics and observations of the botnet.Disclaimer: I don't normally deal with malicious code analysis. My main focuses are on vulnerability discovery and general reversing so dedicating some time to analyzing Kraken was a new and interesting experience. There are many resources available on malware unpacking, PE import table reconstruction etc. so I'll skip right to the specifics of the sample. The offsets and analysis shown below are from sample 31b68fe29241d172675ca8c59b97d4f4 from Offensive Computing.
When Kraken first starts it enters an infinite loop trying to locate a master (command and control) server on UDP port 447 over a custom encrypted protocol. The contacted hostnames all reside with dynamic DNS providers with a randomly generated sub-domain. Here is a look at the function responsible for algorithmically generating the domains to connect to, keep a close eye on the second argument which is used as the seed in the generation process:
    .text:001AE810  mov     esi, [ebp+seed]
    .text:001AE813  sar     esi, 1
    .text:001AE815  add     esi, 0F424Fh
    .text:001AE81B  push    edi
    .text:001AE81C  lea     ecx, [ebp+var_10]
    .text:001AE81F  mov     [ebp+seed], esi
    ...
    .text:001AE83D  lea     ecx, [esi+7]
    .text:001AE840  lea     eax, [esi+0Ch]
    .text:001AE843  imul    eax, ecx
    .text:001AE846  imul    eax, esi
    .text:001AE849  cdq
    .text:001AE84A  pop     ecx
    .text:001AE84B  idiv    ecx
    .text:001AE84D  lea     ecx, [esi+1]
    .text:001AE850  imul    ecx, esi
    .text:001AE853  lea     ecx, [eax+ecx-0FCFBF88h]
    .text:001AE85A  jmp     short loc_1AE87C
    ...
    .text:001AE87C  imul    ecx, 41C64E6Dh
    .text:001AE882  mov     edi, 3093h
    .text:001AE887  add     ecx, edi
    .text:001AE889  mov     eax, ecx
    .text:001AE88B  imul    ecx, 41C64E6Dh
    .text:001AE891  add     ecx, edi
    .text:001AE893  ror     eax, 8
    .text:001AE896  mov     edx, ecx
    .text:001AE898  imul    ecx, 41C64E6Dh
    .text:001AE89E  mov     esi, 7FFFh
    .text:001AE8A3  and     eax, esi
    .text:001AE8A5  ror     edx, 8
    .text:001AE8A8  and     edx, esi
    .text:001AE8AA  imul    eax, edx
    .text:001AE8AD  add     ecx, edi
    .text:001AE8AF  mov     ebx, ecx
    .text:001AE8B1  ror     ecx, 8
    .text:001AE8B4  and     ecx, esi
    .text:001AE8B6  sub     eax, ecx
    .text:001AE8B8  push    6
    .text:001AE8BA  cdq
    .text:001AE8BB  pop     ecx
    .text:001AE8BC  idiv    ecx
    .text:001AE8BE  add     edx, ecx
    ...
The seed is crucial to the position in the control server list and starts at 0 on reboot. At the end of this function we see an array of domain names being access that are appended to the generated name:
    .text:001AE91D  push    dynamic_host_names[eax*4] ; lpString
    .text:001AE924  lea     ecx, [ebp+var_20]
    .text:001AE927  call    makeNewString
    .text:001AE92C  push    eax
    .text:001AE92D  push    [ebp+hostname]
    .text:001AE930  lea     eax, [ebp+var_18]
    .text:001AE933  push    eax
    .text:001AE934  lea     eax, [ebp+var_8]
    .text:001AE937  push    eax
    .text:001AE938  lea     ecx, [ebp+var_10]
    .text:001AE93B  call    concatenateStrings

    .data:001B5064 dynamic_host_names dd offset aDyndns_org
    .data:001B5064                          ; "dyndns.org"
    .data:001B5068  dd offset aYi_org       ; "yi.org"
    .data:001B506C  dd offset aDynserv_com  ; "dynserv.com"
    .data:001B5070  dd offset aMooo_com     ; "mooo.com"
Each generated host is checked twice before moving on to the next one, here are the first 5 hosts that will attempt to be contacted:
    rbqdxflojkj.mooo.com
    bltjhzqp.dyndns.org
    cffxugijxn.yi.org
    etllejr.dynserv.com
    ejfjyd.mooo.com
For those who are interested, here is a list of the first 15,000 hosts. Note that as of the time of this research the first Kraken server that was up and responding was 15th down the list afmbtgyktty.yi.org on IP address 66.29.58.119. Armed with this information we registered the first of the available hosts and immediately began getting requests from live Kraken infections in the wild. See "Kraken Botnet Infiltration" for more information regarding general statistics and observations of the botnet.
Knowing now that it is theoretically possible to overtake the Kraken network the next step is to examine the protocol. Looking through the binary there are several calls on the socket connection it makes over UDP port 447 to the control servers. All of these calls are preceded with a send to the control server with an encrypted header:
    .text:001A83C5  call    getEncryptionKeys
    .text:001A83CA  mov     dword ptr [esp+80h+send_buffer], eax
    .text:001A83CE  lea     eax, [esp+80h+send_buffer]
    .text:001A83D2  mov     [esp+80h+var_2C], edx
    .text:001A83D6  mov     [esp+80h+var_28], ebx
    .text:001A83DA  mov     [esp+80h+var_24], 1
    .text:001A83DF  mov     [esp+80h+var_23], bl
    .text:001A83E3  mov     [esp+80h+var_22], 137h
    .text:001A83EA  mov     [esp+80h+var_20], ebx
    .text:001A83EE  mov     [esp+80h+var_1C], ebx
    .text:001A83F2  call    encryptHeader
    ...
    .text:001A8418  push    10h             ; tolen
    .text:001A841A  lea     eax, [esp+84h+to]
    .text:001A841E  push    eax             ; to
    .text:001A841F  push    ebx             ; flags
    .text:001A8420  push    18h             ; len
    .text:001A8422  lea     eax, [esp+90h+send_buffer]
    .text:001A8426  push    eax             ; buf
    .text:001A8427  push    [esp+94h+s]     ; s
    .text:001A842B  call    ds:sendto
As we can see (note that all of the symbols were manually added through reverse engineering) we get some sort of encryption key, build the header, and encrypt the header before sending. Obviously we have to figure out the encryption so we can get a better look at the command and control protocol.
I have seen some mention and packet dumps of the header on various blogs. They often state the first 8 bytes of kraken traffic is static and there is a simple reason for this. Kraken, when communicating, prepends its encryption keys so the server can properly decrypt/encrypt traffic. We can see this in the getEncryptionKeys function. It is host specific and computes the 64 bit key from various aspects of the host hardware. Abbreviated pseudo code for the function is below.
    mov     ds:encryption_key_1, 0DCBA2C5Ah
    mov     ds:encryption_key_2, 50E41593h
    GetAdaptersInfo()
    while (*adapter_info != 0) {
        for (i=0; i < adapter_info.AddressLength; i++) {
            ...
        }
        adapter_info = *adapter_info
    }
    encryption_key_uno += cpuid(0x0).max_input_value
    encryption_key_dos += cpuid(0x0).inel
    encryption_key_uno ^= cpuid(0x1).version
    encryption_key_dos ^= cpuid(0x1).features
    encryption_key_uno ^= cpuid(0x3).hi_serial
    encryption_key_dos ^= cpuid(0x3).low_serial

    encryption_key_uno -= GetVolumeInformation(GetWindowsDirectoryA()).VolumeSerialNumber
As previously stated we can easily get the encryption keys from the packets sent to our tap resolved from the dyndns names we registered. This is a good starting point for writing our decryption/encryption routines. At this point we know the traffic is encrypted, we know a header is sent to the remote dyndns server, and we know that in order to see into this traffic on a large scale we must decrypt the traffic. The function for decrypting our header is shown here:
    .text:001AE7E4 decryptHeader
    .text:001AE7E4  push    ecx
    .text:001AE7E5  mov     eax, [esi+packet_data.seed]
    .text:001AE7E8  test    eax, eax
    .text:001AE7EA  jz      short loc_1AE802
    .text:001AE7EC  push    1               ; flag
    .text:001AE7EE  push    eax             ; seed
    .text:001AE7EF  push    [esi+packet_data.key_2] ; key_2
    .text:001AE7F2  lea     eax, [esi+packet_data.command]
    .text:001AE7F5  push    [esi+packet_data.key_1] ; key_1
    .text:001AE7F7  push    0Ch             ; count
    .text:001AE7F9  push    eax             ; offset
    .text:001AE7FA  call    decryptPacket
    .text:001AE7FF  add     esp, 18h
    .text:001AE802
    .text:001AE802 loc_1AE802:
    .text:001AE802  and     dword ptr [esi+8], 0
    .text:001AE806  pop     ecx
    .text:001AE807  retn
    .text:001AE807 decryptHeader   endp
So we call another function that is used in various places in the binary called decryptPacket passing in various data to specify what we are decrypting. The decryptPacket is a larger function that is a pretty straight forward encryption routine. It does not appear, in my opinion, to be based off of any open encryption algorithm (I will skip the details of the encryption for brevity). After writing the decryption for the header we can see more of the protocol. The first packet being sent by this bot correlates to what we saw in the disassembly above.
    ac 8d ee d7 94 49 09 3f 00 00 00 00 01 00 37 01 00
    00 00 00 00 00 00 00
The protocol breaks down as follows.
    struct KrakenHeader {
        unsigned int key_1;
        unsigned int key_2;
        unsigned int seed;
        unsigned short command;
        unsigned short version;
        umsigned int size;
        unsigned int crc;
        unsigned char payload[size];
    } kraken_header;
So obviously we head off to see what the commands do. In the main command processing function we see a branch based off the command in our incoming packet.
    .text:001AC170  mov     eax, [esp+2C0h+command]
    .text:001AC174  sub     eax, 7
    .text:001AC177  pop     ecx
    .text:001AC178  pop     ecx
    .text:001AC179  jz      command7
    .text:001AC17F  dec     eax
    .text:001AC180  jz      command8
    .text:001AC186  sub     eax, 10h
    .text:001AC189  jz      command18
    .text:001AC18F  xor     esi, esi
    .text:001AC191  cmp     ds:dword_1B109C, ebx
    .text:001AC197  mov     [esp+2B8h+var_2A5], bl
    .text:001AC19B  jle     short loc_1AC1D7
    ...
This is certainly not a complete list of the commands, but it leads us to an interesting function. If we follow command8 we notice a method for updating the bots code. The code takes in an XML-like list of modules, module names, ids, etc. and from there processes the items looking for any updates. Analyzing the code reveals that the following format must be utilized to reach the code we are after:
    <modules>
      <module>
        <version>0</version>
        <name>core</name>
        <moduleid>1</moduleid>
        <crc>0</crc>
      </module>
    </modules>
The reason for this is when the bot sees that a "core" module is being sent it will download said module, write it to disk, and execute it. In the code you can also determine that the values for version, moduleid, and crc are not really checked when a "core" module is being loaded (Aside from not being 0 in some cases).
At this point we realize (and confirm our assumption) that code can arbitrarily be downloaded and executed on the zombie host as long as we can receive its initial beacon. In order to demonstrate this I have removed the details but outlined the needed steps below.
- Receive initial packet from zombie (command 1)
- Send a response with the key xor'd by the server (command 2)
- Receive the zombies configuration information (command 3)
- Send a request to update our module (command 8)
- Send our module update xml to the zombie (command 0x14)
- Open a TCP connection on port 447 for the zombie to download the module
- Receive the connection from the zombie
- Send our encrypted payload to the zombie (command 0xa)
After the zombie has received the payload it decrypts it, and runs a CRC on the payload ensuring it matches what is in the header. This CRC is fairly simple and is below in Python.
    for x in range(0x100):
        eax = x
        for x in range(8):
            if (output.byte(eax) & 1) == 0:
                eax >>= 1
            else:
                eax >>= 1
                eax ^= 0xedb88320
        xor_array.append(eax)

    eax = ~flag
    ecx = 0
    for x in range(fsize):
        esi = (0x00000000 | struct.unpack("<B", f[x])[0])
        edx = eax
        edx &= 0xff
        edx ^= esi
        eax = output.dword(eax) >> 8
        eax ^= xor_array[edx]

    crc = ~eax

    return output.dword(crc)
If we pass the CRC check the payload gets written to a random name in c:\windows\system32 and executed. This can be seen in the binary below.
    .text:001ADE8C  call    openWriteFile
    .text:001ADE91  add     esp, 0Ch
    .text:001ADE94  push    0FFFFFFFFh          ; dwMilliseconds
    .text:001ADE96  push    ebx                 ; char
    .text:001ADE97  push    [ebp+lpCommandLine] ; lpCommandLine
    .text:001ADE9A  call    startNewProcess     ; do our command
Where CommandLine is the path to our newly downloaded payload. As you can see it is certainly possible to upload new code to a bot as long as you can receive traffic from a zombie checking in. To demonstrate this I have created a video that puts all these steps into practice loading arbitrary code on a zombie host running in a VM.
The video first walks you through the code path which will be executed. The video shows two systems. The host system is responsible for emulating the Kraken server. The VMWare image is of a system infected with Kraken. In the end the video will demonstrate a custom Kraken server I have written and the Kraken zombie will eventually spawn a reverse connect back shell that I have uploaded to it via the emulated Kraken server. The shell demonstrates full control over the zombie system.
Note: The code used to accomplish the various tasks outlined in this blog are not being released for obvious reasons. If you are a security firm with legitimate reasons for further information and proof-of-concept code contact us.
Originally published 2008-04-28 on the TippingPoint DVLabs blog. Written with Cody Pierce, who also wrote the dissection.
| PyDbg Hacks | 2007-08-23 |
Just added some PyDbg based hacks to the public repository (should show up within an hour max of this post). Here is a description of what was added:
just_in_time_debugger.py
PyDbg implementation of a script that can be set as the Just-In-Time debugger. Logs the crash context to disk. I'll be blogging about / giving out a standalone executable based on this script for those of you who want to e-mail all your crash dumps to ... me ;-)
stack_integrity_monitor.py
Automatically locate the source of a stack overflow. This has already been released, just hasn't been previously part of the repo. For more info see the related blog entry.
pydbgc.py
Cody's PyDbg command line interface library. This is pretty cool, you can import it to drop a user into an interactive PyDbg shell at any point during execution. Gives you WinDbg-esque commands. One of the cooler features of this hack is that it allows you to step backwards, really.
push_pop_unpacker.py
This is a quick and dirty PyDbg implementation of a known generic technique for stopping an unpacker at OEP. This script was written during Ero and I's 2007 Reverse Engineering class at BlackHat. It took like 20 minutes to write, gotta love PyDbg.
null_selector_mem_monitor_poc.py
Pydbg implementation of skape's null selector mem-monitor technique. Read more about it on Uninformed Journal
Get all the new goodies at http://paimei.openrce.org.
Originally published 2007-08-23 on OpenRCE.
| Greatest Book Dedication Ever? | 2007-07-09 |
Not to brag or anything, but who can deny this as the greatest book dedication the world has ever seen:
Fuzzing: Brute Force Vulnerability Discovery - Dedication
If you are interested in buying the book:
Amazon
For those of you without a PDF reader, the dedication reads:
"I dedicate this book to George W. Bush, my Commander-in-Chief, whose impressive career advancement despite remedial language skills inspired me to believe that I was capable of authoring a book."
Originally published 2007-07-09 on the TippingPoint DVLabs blog.
| Pin Pointing Stack Smashes | 2007-05-07 |
This was originally posted over on my company blog site (TippingPoint DVLabs). Since the DVLabs blog is new I'm cross posting here to draw some traffic to it. Tracking down stack overflows is tedious work. Especially when the entire stack is blown away leaving you with crash dumps like the excerpt following this paragraph. This crash dump is from an actual process in case you are curious. Specifically, it is from one of the bugs detailed in TPTI-07-02: Trend Micro ServerProtect eng50.dll Stack Overflow Vulnerabilities. It's pretty obvious that it's game over for our target here. The important question to answer at this juncture is, where is the bug? There are a number of approaches you can take to manually handle this situation. Please add any creative ones you may have as a comment.
    [INVALID]:41414141 Unable to disassemble at 41414141 from thread 568
    caused access violation when attempting to read from 0x41414141

    CONTEXT DUMP
      EIP: 41414141 Unable to disassemble at 41414141
      EAX: 00000001 (         1) - N/A
      EBX: 0259eedc (  39448284) - AAAAAAAAAAAAA.....AAAAAAAAAAAAAAAAAAAAA (stack)
      ECX: 00000000 (         0) - N/A
      EDX: ffffffff (4294967295) - N/A
      EDI: 00000000 (         0) - N/A
      ESI: 0259f102 (  39448834) - AAAAAAAAAAAAA.....AAAAAAAAAAAAAAAAAAAAA (stack)
      EBP: 00000001 (         1) - N/A
      ESP: 0259e2d4 (  39445204) - AAAAAAAAAAAAA.....AAAAAAAAAAAAAAAAAAAAA (stack)
      +00: 41414141 (1094795585) - N/A
      +04: 41414141 (1094795585) - N/A
      +08: 41414141 (1094795585) - N/A
      +0c: 41414141 (1094795585) - N/A
      +10: 41414141 (1094795585) - N/A
      +14: 41414141 (1094795585) - N/A

    disasm around:
            0x41414141 Unable to disassemble
In this blog entry, I present stack_integrity_monitor.py. A command line utility implemented in under 150 lines of Python code which provides an automated solution to the task of tracking down the source of a stack overflow. This Python utility leverages PyDbg, a pure-Python win32 debugger interface. PyDbg is part of the larger PaiMei Reverse Engineering Framework. If you've never heard of PaiMei before, follow the link to learn more.
The main reason stack overflows are exploitable is because control information is stored in the same medium as volatile user-controllable data. If we can move or mirror the call-chain "out of band", then we can verify the integrity of the stack at run-time. Skipping over the intricate details, here is the high level overview of how the utility works:
- Instantiate a debugger object and attach to the target program.
- Set a breakpoint where we want the trace to start, this can be as simple as setting a break on recv().
- Once the breakpoint is hit, set the active thread to single step.
- When a CALL instruction is reached, copy the stack and return addresses to an internal "mirror" list.
- When a RET instruction is reached, walk through the "mirror" list and verify that the values match the actual stack.
- When the last saved return address is reached, pop it off the internal "mirror" list.
    0259fc24: TmRpcSrv.dll.65741721
    0259e7b4: StRpcSrv.dll.65671190
    0259e7a8: Eng50.dll.61181d8c
    0259e790: Eng50.dll.611819a0
    0259e564: Eng50.dll.61181a50
    0259e2d0: Eng50.dll.61190fa4 -- 41414141
    0259e03c: Eng50.dll.61190fd2
Examining the vicinity of the last return address in the list, we find:
    61190FC7 lea edx, [esp+288h+szShortPath]
    61190FCB push esi
    61190FCC push edx
    61190FCD call _wcscpy
    61190FD2 add esp, 8
The wcscpy() is the source of the stack overflow. The origin of the overflowed buffer is obvious in this case, it resides in the current function frame with a size of 600 bytes. Had the overflow occurred in a buffer originating further up the call chain the stack_integrity_monitor would have told us. In this case we see the stack mismatch occurred at stack address 0x0259e2d0 which should contain the return address 0x61190fa4 but instead contains 0x41414141. Had even a single byte of the return address been overwritten, stack_integrity_monitor would have detected it.
This handy command line utility has been checked into the PaiMei SVN repository and will be distributed with future releases of the reverse engineering framework. Future improvements may include speed boosts and perhaps additionally mirroring saved frame pointers. This quick hack was written in less than 2 hours and motivated from necessity, on a day where I happened to need to track down a dozen or so stack overflows. Give it a try, let me know what you think.
| Branch Tracing with Intel MSR Registers | 2006-12-13 |
The ability to "trace" code is rather useful and can be leveraged to ease the burden of a number of tasks ranging from standard issue debugging to vulnerability hunting to malware analysis and more. Debuggers such as OllyDbg implement code tracing via conventional single stepping. This is easily accomplished in a debugger by setting the appropriate EFlag bit in the thread context you wish to single step (Python Win32 example):
    context = self.get_thread_context(thread_handle)
    context.EFlags = context.EFlags & (0xFFFFFFFFFF ^ EFLAGS_TRAP)
    self.set_thread_context(context, thread_handle=thread_handle)
One by one, as instructions are executed the debugger is trapped with an EXCEPTION_SINGLE_STEP event. In the case of OllyDbg, various register states are stored and execution is continued. For those of you who haven't used this feature before, believe me when I say that it's painfully slow on medium to large chunks of code. This was one of my main motivations behind creating the PaiMei Process Stalker module. Process Stalker improves code tracing speed by monitoring execution of basic blocks as opposed to individual instructions. What exactly does this mean? Sequences of assembly instructions can be broken down into "basic blocks". Basic blocks can be grouped together to form Control-Flow Graphs (CFGs). These are familiar terms but for those of you who don't know it, consider the following example deadlisting:
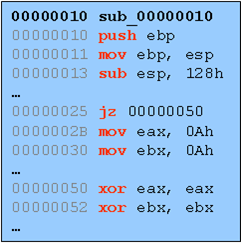
This straight sequence can be broken into basic blocks which are defined as sub-sequences of instructions where each instruction within the block is guaranteed to be run, in order, once the first instruction of the basic block is reached. The strict definition for basic blocks differs here and there, for example you may or may not want to consider a CALL instruction the end of a basic block (depending on whether you care to take the effort to determine if that CALL is guaranteed to return). You get the general idea though. Here is that same sequence broken down into a CFG:
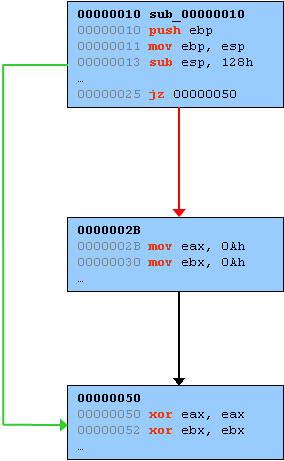
Instead of tracing code at the instruction level, Process Stalker traces code at a higher level by setting and monitoring breakpoints at the head of every basic block. Since every instruction within a block is guaranteed to be executed once the block is reached, there is no need to trace any further into the block. Improving code trace speed using the basic block method is not a novel idea, SABRE Securities commercial product Bin Navi utilizies the same technique. Even more creative mechanisms for improving trace speed have been developed as well: See Matt Conover's project list at http://www.cybertech.net/~sh0ksh0k/projects/ as well as the recent blog entry and tool announce from McAfee at UMSS: Efficient Single Stepping on Win32.
There are downfalls to all of these shortcuts howevever. The creative ones can get quite complicated and the basic block method requires that the target binary is pre-analyzed to determine the location of all the basic blocks. To successfully enumerate basic blocks you must first correctly differentiate between code and data within an individual binary. This is harder said then done which is why both Process Stalker and Bin Navi really on IDA Pro's analysis. This is a drag because not only does it introduce significant steps to setup the trace but IDA can make mistakes that can botch the entire trace. An improved version of basic block tracing is desired.
Some time ago I was flipping through the IA-32 Intel Architecture Softwre Developer's Manual Volume 3 when I came across the following information in section 15.5 (page 515, specific to the provided link):
    The MSR_DEBUGCTLA MSR enables and disables the various
    last branch recording mechanisms described in the previous
    section. This register can be written to using the WRMSR
    instruction, when operating at privilege level 0 or when
    in real-address mode. A protected-mode operating system
    procedure is required to provide user access to this register.
    Figure 15-4 shows the flags in the MSR_DEBUGCTLA MSR. The
    functions of these flags are as follows:
    ...
    BTF (single-step on branches) flag (bit 1)
    When set, the processor treats the TF flag in the EFLAGS
    register as a "singlestep on branches" flag rather than a
    "single-step on instructions" flag. This mechanism allows
    single-stepping the processor on taken branches, interrupts,
    and exceptions. See Section 15.5.4., "Single-Stepping on
    Branches, Exceptions, and Interrupts" for more information
    about the BTF flag.
According to the documentation, the behaviour of single step can be altered through a flag in one of the Model Specific Registers (MSRs). So I threw some PyDbg based Python code together to test this out. First, I implemented a conventional single step tracer: tracer_single_step.py. Next, I modified that tracer with the appropriate MSR setting code: tracer_msr_branch.py. Ran them both and to my pleasant surprise it worked like a charm. Try them for yourself. Attach to and interact with calculator with the single step tracer then try it again with the MSR tracer, the speed difference is quite notable. Implementing the MSR tracer required almost minimal changes. First, some definitions:
    SysDbgReadMsr  = 16
    SysDbgWriteMsr = 17

    ULONG     = c_ulong
    ULONGLONG = c_ulonglong

    class SYSDBG_MSR(Structure):
        _fields_ = [
            ("Address", ULONG),
            ("Data",    ULONGLONG),
    ]

    def write_msr():
        msr = SYSDBG_MSR()
        msr.Address = 0x1D9
        msr.Data = 2
        status = windll.ntdll.NtSystemDebugControl( \
            SysDbgWriteMsr,
            byref(msr),
            sizeof(SYSDBG_MSR),
            0,
            0,
            0);
The write_msr() routine defined above utilizes the NtSystemDebugControl() Windows native API (special thanks to Alex Ionescu for his help with this) to set the appropriate MSR values specific to my Pentium M processor. Your mileage may vary with those values, check the Intel manual for the appropriate numbers. Next, all you have to do is follow every call to single_step() with a call to write_msr():
    # re-raise the single step flag on every block.
    def handler_single_step (dbg):
        ...
        dbg.single_step(True)
        write_msr()
        return DBG_CONTINUE

    # ensure every new thread starts in single step mode.
    def handler_new_thread (dbg):
        dbg.single_step(True)
        write_msr()
        return DBG_CONTINUE
I'll be adding MSR routines to PyDbg in a future release and will also release a new version of Process Stalker that does not require any pre-analysis to accomplish its code tracing... When I find the time to do all that I may expand this blog entry with further details and examples into a full blown article.
Caveat Emptor: It appears that you can kill your CPU if you carelessly fool around with MSRs. So there, I said it, be warned.