| PyTrAn: Python Traffic Analyzer |
Note: TrafficLand has modified their process of serving images and I have not had the time to update PyTrAn or the web interface to handle it.
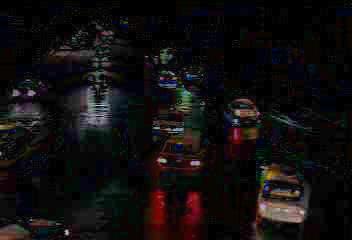
Some time ago I came across a traffic camera service from TrafficLand covering the DC, Virginia and Maryland metro area. They make individual camera feeds available free of charge and provide a pay-for service featuring a multi-screen interface. The images are not the best quality, here is a live example from Key bridge in North West DC (camera ID 200003):
After 30 minutes of playing with the free feed I got motiviated and wrote a script to enumerate the camera list and created my own custom
multi-screen interface allowing for regex searches and customizable row/column control. This interface is available at:
http://pedram.redhive.com/traffic/
After some discussion with a co-worker a new idea was born. While viewing current traffic conditions may be interesting, what would be more
interesting is the ability to programatically assign a numeric value to the current traffic flow. To accomplish this I wrote a
Python class, PyTrAn, built on simple command line utilities such as cURL,
Netpbm and libjpeg.
PyTrAn, an example driver script, an image collector and an image mask creator are available for download from the link shown at the bottom. To use
the PyTrAn package begin by choosing a camera that you wish to analyze, for this example we'll use the camera captioned above. We want to construct
a mask over the area of the image that we are interested in, namely the road. In this particular example the road takes up the majority of the image
but that is not always the case. We will apply the mask over captured images to fine tune the area over which we are looking for movement. To create
the mask we will first need to collect a sequential series of snapshots from the target camera. The image_collector.py script was written for this task:
$ mkdir mask_200003
$ cd mask_200003
$ ../image_collector.py 200003 30
Collecting 30 images...
30

Done.
The script is hard coded to capture images on a 2-second delay. The delay is necessary to ensure the image has changed. I believe 2-seconds to be the absolute minimum. Once complete, 30 images numbered 1 through 30 will be created in the current directory. We construct a mask from these captured images by creating a diff-image for each sequential image pair and then adding each diff-image together. Naturally, a script was written to automate this task as well:
$ ../mask_maker.py 1 30
Creating a diff for each sequential image pair.
Diffing 29

Creating the initial mask from the first image pair.

Adding the rest of the diffs to the mask.
Masking 29

Done.
A number of .diff files are generated in this process. These files repesent the movement between individual sequence pairs. Here is one of the diff-images from our example:
The .diff files are simply intermediary files, the important bit is the 'mask' file, which is generated as the sum of all differences:
The mask file may be dirty (as in this case) and require manual cleanup. The basic shape of the road however is clearly visible, evidence that we can with minimal effort automate the mask generation process. Also, this run was conducted at night, day-time images yield better results. Here is what our mask looks like after it's been cleaned up by hand:

There are a few final steps we need to take before we can use the example PyTrAn driver script. First we need to convert the mask to ASCII (noraw) format:
$ pnmnoraw mask > mask_200003.ascii
Then we need to open an ImageMagick 'display' window and get it's X-window-ID using 'xwininfo'. Finally, update 'camera_id' and 'window_id' in pytran_sampling.py and launch the driver:
$ ../pytran_sampling.py
DEBUG> grabbing frame from camera 200003
DEBUG> rotating image: pytran.this > pytran.last
DEBUG> refreshing image in 3 secs
taking a 5 minute sample at various thresholds.
DEBUG> grabbing frame from camera 200003
DEBUG> generating frame diff on pytran.last, pytran.this
DEBUG> displaying image: pytran.diff
DEBUG> converting pytran.diff to ascii
DEBUG> calculating traffic ratio...
ratio[5]: 55%
DEBUG> calculating traffic ratio...
ratio[10]: 52%
...
...
5 minute sample[5]:  67.88
5 minute sample[10]: 42.66
5 minute sample[15]: 30.57
5 minute sample[20]: 23.03
5 minute sample[25]: 18.39
5 minute sample[30]: 14.79
5 minute sample[35]: 12.42
5 minute sample[40]: 10.53
5 minute sample[45]: 9.06
5 minute sample[50]: 7.85
The sampling script will take 5 minute samples at varying color thresholds. The optimal threshold must be manually chosen.
Furthermore, you will need to sample the traffic ratio's during both heavy and light traffic
times to get a good feel for your acceptable range. Also, keep in mind that the traffic ratio value is simply the percent change detected, or in other words the
movement detected within the masked region. This means that a completely empty road will register similar values to a road so
congested it looks like a parking lot. The time of day can be combined with the traffic ration to determine the logical truth.
With this task implemented and abstracted more complex systems can be built. When I find the time I'd like to create a system that will take multiple potential
travel routes and times, and during the travel time e-mail the traveler with the best route to take. Another idea I had would be
to record the traffic flow values for each camera, for each day and for each half hour interval. Travelers and other interested
parties can then analyze traffic patterns to determine the fastest route dependant on date/time.