| Pin Pointing Stack Smashes | 2007-05-07 |
This was originally posted over on my company blog site (TippingPoint DVLabs). Since the DVLabs blog is new I'm cross posting here to draw some traffic to it. Tracking down stack overflows is tedious work. Especially when the entire stack is blown away leaving you with crash dumps like the excerpt following this paragraph. This crash dump is from an actual process in case you are curious. Specifically, it is from one of the bugs detailed in TPTI-07-02: Trend Micro ServerProtect eng50.dll Stack Overflow Vulnerabilities. It's pretty obvious that it's game over for our target here. The important question to answer at this juncture is, where is the bug? There are a number of approaches you can take to manually handle this situation. Please add any creative ones you may have as a comment.
    [INVALID]:41414141 Unable to disassemble at 41414141 from thread 568
    caused access violation when attempting to read from 0x41414141

    CONTEXT DUMP
      EIP: 41414141 Unable to disassemble at 41414141
      EAX: 00000001 (         1) - N/A
      EBX: 0259eedc (  39448284) - AAAAAAAAAAAAA.....AAAAAAAAAAAAAAAAAAAAA (stack)
      ECX: 00000000 (         0) - N/A
      EDX: ffffffff (4294967295) - N/A
      EDI: 00000000 (         0) - N/A
      ESI: 0259f102 (  39448834) - AAAAAAAAAAAAA.....AAAAAAAAAAAAAAAAAAAAA (stack)
      EBP: 00000001 (         1) - N/A
      ESP: 0259e2d4 (  39445204) - AAAAAAAAAAAAA.....AAAAAAAAAAAAAAAAAAAAA (stack)
      +00: 41414141 (1094795585) - N/A
      +04: 41414141 (1094795585) - N/A
      +08: 41414141 (1094795585) - N/A
      +0c: 41414141 (1094795585) - N/A
      +10: 41414141 (1094795585) - N/A
      +14: 41414141 (1094795585) - N/A

    disasm around:
            0x41414141 Unable to disassemble
In this blog entry, I present stack_integrity_monitor.py. A command line utility implemented in under 150 lines of Python code which provides an automated solution to the task of tracking down the source of a stack overflow. This Python utility leverages PyDbg, a pure-Python win32 debugger interface. PyDbg is part of the larger PaiMei Reverse Engineering Framework. If you've never heard of PaiMei before, follow the link to learn more.
The main reason stack overflows are exploitable is because control information is stored in the same medium as volatile user-controllable data. If we can move or mirror the call-chain "out of band", then we can verify the integrity of the stack at run-time. Skipping over the intricate details, here is the high level overview of how the utility works:
- Instantiate a debugger object and attach to the target program.
- Set a breakpoint where we want the trace to start, this can be as simple as setting a break on recv().
- Once the breakpoint is hit, set the active thread to single step.
- When a CALL instruction is reached, copy the stack and return addresses to an internal "mirror" list.
- When a RET instruction is reached, walk through the "mirror" list and verify that the values match the actual stack.
- When the last saved return address is reached, pop it off the internal "mirror" list.
    0259fc24: TmRpcSrv.dll.65741721
    0259e7b4: StRpcSrv.dll.65671190
    0259e7a8: Eng50.dll.61181d8c
    0259e790: Eng50.dll.611819a0
    0259e564: Eng50.dll.61181a50
    0259e2d0: Eng50.dll.61190fa4 -- 41414141
    0259e03c: Eng50.dll.61190fd2
Examining the vicinity of the last return address in the list, we find:
    61190FC7 lea edx, [esp+288h+szShortPath]
    61190FCB push esi
    61190FCC push edx
    61190FCD call _wcscpy
    61190FD2 add esp, 8
The wcscpy() is the source of the stack overflow. The origin of the overflowed buffer is obvious in this case, it resides in the current function frame with a size of 600 bytes. Had the overflow occurred in a buffer originating further up the call chain the stack_integrity_monitor would have told us. In this case we see the stack mismatch occurred at stack address 0x0259e2d0 which should contain the return address 0x61190fa4 but instead contains 0x41414141. Had even a single byte of the return address been overwritten, stack_integrity_monitor would have detected it.
This handy command line utility has been checked into the PaiMei SVN repository and will be distributed with future releases of the reverse engineering framework. Future improvements may include speed boosts and perhaps additionally mirroring saved frame pointers. This quick hack was written in less than 2 hours and motivated from necessity, on a day where I happened to need to track down a dozen or so stack overflows. Give it a try, let me know what you think.
| Branch Tracing with Intel MSR Registers | 2006-12-13 |
The ability to "trace" code is rather useful and can be leveraged to ease the burden of a number of tasks ranging from standard issue debugging to vulnerability hunting to malware analysis and more. Debuggers such as OllyDbg implement code tracing via conventional single stepping. This is easily accomplished in a debugger by setting the appropriate EFlag bit in the thread context you wish to single step (Python Win32 example):
    context = self.get_thread_context(thread_handle)
    context.EFlags = context.EFlags & (0xFFFFFFFFFF ^ EFLAGS_TRAP)
    self.set_thread_context(context, thread_handle=thread_handle)
One by one, as instructions are executed the debugger is trapped with an EXCEPTION_SINGLE_STEP event. In the case of OllyDbg, various register states are stored and execution is continued. For those of you who haven't used this feature before, believe me when I say that it's painfully slow on medium to large chunks of code. This was one of my main motivations behind creating the PaiMei Process Stalker module. Process Stalker improves code tracing speed by monitoring execution of basic blocks as opposed to individual instructions. What exactly does this mean? Sequences of assembly instructions can be broken down into "basic blocks". Basic blocks can be grouped together to form Control-Flow Graphs (CFGs). These are familiar terms but for those of you who don't know it, consider the following example deadlisting:
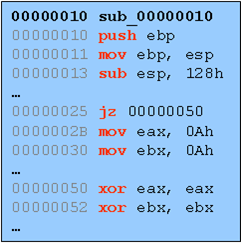
This straight sequence can be broken into basic blocks which are defined as sub-sequences of instructions where each instruction within the block is guaranteed to be run, in order, once the first instruction of the basic block is reached. The strict definition for basic blocks differs here and there, for example you may or may not want to consider a CALL instruction the end of a basic block (depending on whether you care to take the effort to determine if that CALL is guaranteed to return). You get the general idea though. Here is that same sequence broken down into a CFG:
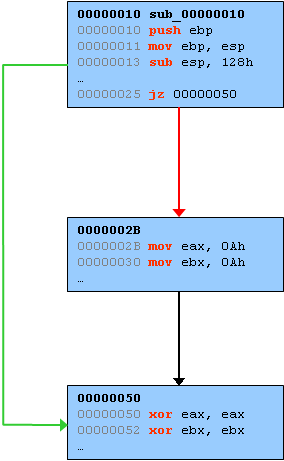
Instead of tracing code at the instruction level, Process Stalker traces code at a higher level by setting and monitoring breakpoints at the head of every basic block. Since every instruction within a block is guaranteed to be executed once the block is reached, there is no need to trace any further into the block. Improving code trace speed using the basic block method is not a novel idea, [http://www.sabre-security.com/]SABRE Securities commercial product Bin Navi utilizies the same technique. Even more creative mechanisms for improving trace speed have been developed as well: See Matt Conover's project list at http://www.cybertech.net/~sh0ksh0k/projects/ as well as the recent blog entry and tool announce from McAfee at UMSS: Efficient Single Stepping on Win32.
There are downfalls to all of these shortcuts howevever. The creative ones can get quite complicated and the basic block method requires that the target binary is pre-analyzed to determine the location of all the basic blocks. To successfully enumerate basic blocks you must first correctly differentiate between code and data within an individual binary. This is harder said then done which is why both Process Stalker and Bin Navi really on IDA Pro's analysis. This is a drag because not only does it introduce significant steps to setup the trace but IDA can make mistakes that can botch the entire trace. An improved version of basic block tracing is desired.
Some time ago I was flipping through the IA-32 Intel Architecture Softwre Developer's Manual Volume 3 when I came across the following information in section 15.5 (page 515, specific to the provided link):
    The MSR_DEBUGCTLA MSR enables and disables the various
    last branch recording mechanisms described in the previous
    section. This register can be written to using the WRMSR
    instruction, when operating at privilege level 0 or when
    in real-address mode. A protected-mode operating system
    procedure is required to provide user access to this register.
    Figure 15-4 shows the flags in the MSR_DEBUGCTLA MSR. The
    functions of these flags are as follows:
    ...
    BTF (single-step on branches) flag (bit 1)
    When set, the processor treats the TF flag in the EFLAGS
    register as a "singlestep on branches" flag rather than a
    "single-step on instructions" flag. This mechanism allows
    single-stepping the processor on taken branches, interrupts,
    and exceptions. See Section 15.5.4., "Single-Stepping on
    Branches, Exceptions, and Interrupts" for more information
    about the BTF flag.
According to the documentation, the behaviour of single step can be altered through a flag in one of the Model Specific Registers (MSRs). So I threw some PyDbg based Python code together to test this out. First, I implemented a conventional single step tracer: tracer_single_step.py. Next, I modified that tracer with the appropriate MSR setting code: tracer_msr_branch.py. Ran them both and to my pleasant surprise it worked like a charm. Try them for yourself. Attach to and interact with calculator with the single step tracer then try it again with the MSR tracer, the speed difference is quite notable. Implementing the MSR tracer required almost minimal changes. First, some definitions:
    SysDbgReadMsr  = 16
    SysDbgWriteMsr = 17

    ULONG     = c_ulong
    ULONGLONG = c_ulonglong

    class SYSDBG_MSR(Structure):
        _fields_ = [
            ("Address", ULONG),
            ("Data",    ULONGLONG),
    ]

    def write_msr():
        msr = SYSDBG_MSR()
        msr.Address = 0x1D9
        msr.Data = 2
        status = windll.ntdll.NtSystemDebugControl( \
            SysDbgWriteMsr,
            byref(msr),
            sizeof(SYSDBG_MSR),
            0,
            0,
            0);
The write_msr() routine defined above utilizes the NtSystemDebugControl() Windows native API (special thanks to Alex Ionescu for his help with this) to set the appropriate MSR values specific to my Pentium M processor. Your mileage may vary with those values, check the Intel manual for the appropriate numbers. Next, all you have to do is follow every call to single_step() with a call to write_msr():
    # re-raise the single step flag on every block.
    def handler_single_step (dbg):
        ...
        dbg.single_step(True)
        write_msr()
        return DBG_CONTINUE

    # ensure every new thread starts in single step mode.
    def handler_new_thread (dbg):
        dbg.single_step(True)
        write_msr()
        return DBG_CONTINUE
I'll be adding MSR routines to PyDbg in a future release and will also release a new version of Process Stalker that does not require any pre-analysis to accomplish its code tracing... When I find the time to do all that I may expand this blog entry with further details and examples into a full blown article.
Caveat Emptor: It appears that you can kill your CPU if you carelessly fool around with MSRs. So there, I said it, be warned.
| Pcapy (Sniffing) on WiFi | 2006-12-09 |
I like to develop on my (Windows) laptop... I also like to develop from the comfort of my sweet Corda-Roy bean bag chair, which means I'll be connected via WiFi. Unfortunately sniffing via Ethereal or CORE's Pcapy library is not possible in this situation. I came up with a convenient 2-step solution to my woe that perhaps others will find useful.
First, snag yourself an Ethernet Loopback Jack and plug it in. This will trick your NIC into thinking it's actually plugged into a network. Next, create a network bridge and add the LAN adapter followed by the WiFi adapter. The network bridge shows up as a new interface that you can sniff on!
***** UPDATE *****
tagetora was kind enough to write me and suggest trying to bridge with a loop back device to avoid the additional hardware. I'm pleased to report that it works like a charm. For instructions on how to create a loop back device see: http://support.microsoft.com/kb/839013.